Once a player unlocks the climate change achievement (Research chemistry lvl 1), they will have access to the page Emissions in the production overviews. There they will see the servers CO2 concentration, the server's climate and their personal emissions.
CO2 Emissions
Sources of CO2 emissions are constructions and all facilities that consume fuel plus the steam engine (controllable facilities). Additionally, the functional facility Carbon Capture can absorb CO2 from the atmosphere and store it.
The atmosphere is shared between all players and the CO2 emitted by all players will increase the server's CO2 concentration. The reference value for the server's "natural" CO2 concentration is 300 ppm parts per million which corresponds to a base value of 40 Mt of CO2 in the atmosphere.
Climate
The server's climate is represented by the global average temperature (GAT). The GAT has a natural seasonal variation due to the asymmetric distribution of land and water on the planet. Due to the important role of CO2 in the greenhouse effect, the server's climate will be affected by the server's CO2 concentration.
The so called global temperature anomaly is the difference between the server's GAT and the reference GAT. This temperature anomaly has a random component due to natural climate variability and a deterministic component proportional to the servers CO2 concentration. The atmosphere will warm up by one degree for every 100 ppm parts per million of additional CO2 concentration with some delay.
Climate Events
Climate events have a low chance of occurring naturally every game tick however, the probability of their occurrence increases with climate change. Climate events are always negative and can have a wide range of consequences.
All tiles do not have the same risk of being affected by a climate event. A climate risk score is visible in the Map that indicates the probability and the severity of the climate events in each tile.
Heatwave
Heatwaves have a higher chance of occurring with higher global temperatures. They have a big impact on the population, especially the elderly and the sick. Heatwaves can also have a negative impact on battery storage technologies and can cause overheating and in some cases permanent damage.
| Recovery time | 3 days |
|---|---|
| Recovery cost | 25% of current industry revenues |
| Affected tiles | 7 (1 and its 6 neighbors) |
| Destruction chances |
Lithium-Ion Batteries: 5% Solid State Batteries: 2% |
The probability of the occurrence of a heatwave is affected by both the global temperature anomaly (the bigger the deviation the higher the risk) and the server's current GAT (the higher the temperature the higher the risk). The following table shows the expected occurrence of heatwaves per in-game day depending on the Reference GAT and the temperature anomaly.
| Temperature Anomaly | |||||||||
|---|---|---|---|---|---|---|---|---|---|
| -4°C | -3°C | -2°C | -1°C | 0°C | +1°C | +2°C | +3°C | +4°C | |
| 11.75°C | - | - | - | - | - | - | - | - | 0.32 |
| 12°C | - | - | - | - | - | - | - | 0.01 | 0.50 |
| 12.5°C | - | - | - | - | - | - | - | 0.17 | 1.01 |
| 13°C | - | - | - | - | - | - | 0.01 | 0.50 | 1.69 |
| 13.5°C | - | - | - | - | - | - | 0.17 | 1.01 | 2.55 |
| 14°C | - | - | - | - | - | 0.01 | 0.50 | 1.69 | 3.58 |
| 14.5°C | - | - | - | - | - | 0.17 | 1.01 | 2.55 | 4.79 |
| 15°C | 1.12 | 0.63 | 0.28 | 0.07 | 0.01 | 0.57 | 1.97 | 4.21 | 7.29 |
| 15.55°C | 4.20 | 2.36 | 1.05 | 0.26 | 0.20 | 1.33 | 3.70 | 7.28 | 12.10 |
When a heatwave occurs, the tile it will affect (with it's neighbors) is chosen randomly following a normal distribution around the equator. This means that the risk is higher in southern tiles and almost zero in northern tiles. The following figure shows the probability distribution overlaid on the map.
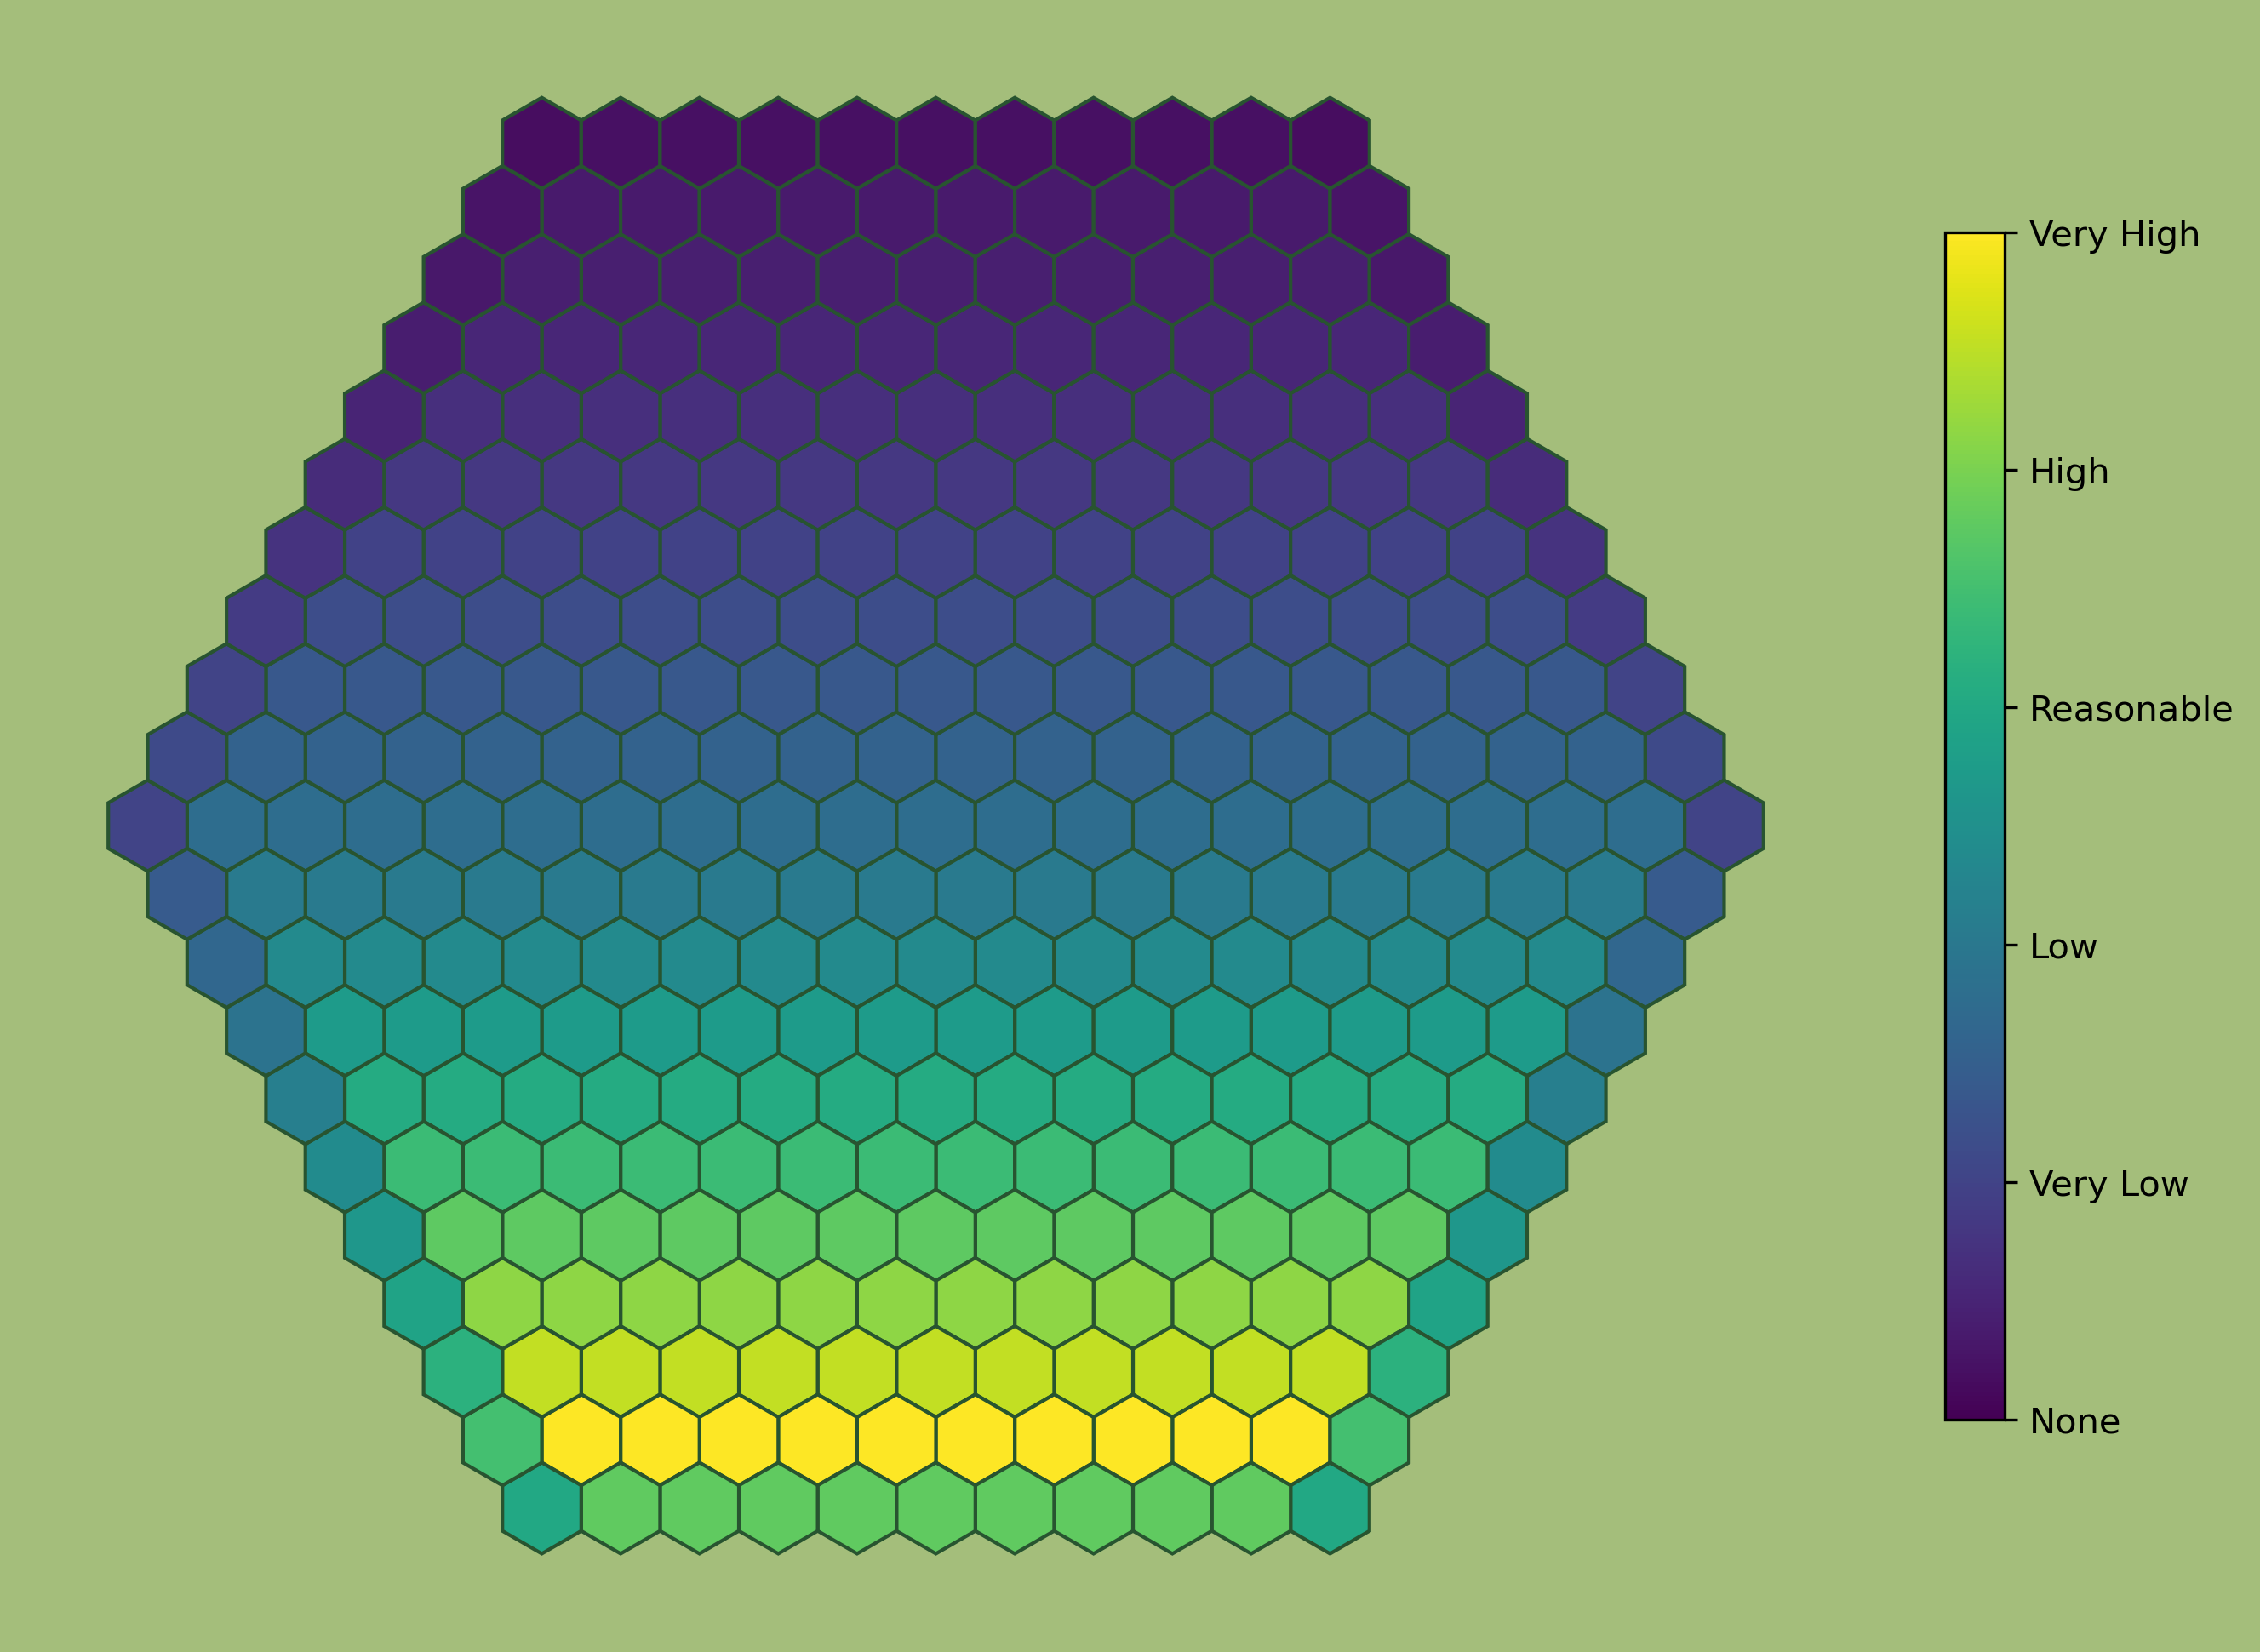
Note that the risks on the edges on the map are lower. This is due to these tiles having less neighbors and therefore reducing the risk of being affected by a nearby heatwave. Considering that the map is an island, we can also explain the lower risks on the edges by the fact that the ocean has a moderating effect on the temperature.
Coldwave
Coldwaves have a higher chance of occurring with lower global temperatures. They have a big impact on the population, especially the elderly.
| Recovery time | 3 days |
|---|---|
| Recovery cost | 25% of current industry revenues |
| Affected tiles | 7 (1 and its 6 neighbors) |
| Destruction chances |
none |
The probability of the occurrence of a coldwave is affected by both the global temperature anomaly (the bigger the deviation the higher the risk) and the servers current GAT (the lower the temperature the higher the risk). The following table shows the expected occurrence of coldwaves per in-game day depending on the Reference GAT and the temperature anomaly.
| Temperature Anomaly | |||||||||
|---|---|---|---|---|---|---|---|---|---|
| -4°C | -3°C | -2°C | -1°C | 0°C | +1°C | +2°C | +3°C | +4°C | |
| 11.75°C | 12.10 | 7.28 | 3.70 | 1.33 | 0.20 | 0.26 | 1.05 | 2.36 | 4.20 |
| 12°C | 9.89 | 5.86 | 2.89 | 0.96 | 0.09 | 0.18 | 0.70 | 1.58 | 2.80 |
| 12.5°C | 5.60 | 3.15 | 1.40 | 0.35 | - | - | - | - | - |
| 13°C | 4.29 | 2.19 | 0.79 | 0.09 | - | - | - | - | - |
| 13.5°C | 3.15 | 1.40 | 0.35 | - | - | - | - | - | - |
| 14°C | 2.19 | 0.79 | 0.09 | - | - | - | - | - | - |
| 14.5°C | 1.40 | 0.35 | - | - | - | - | - | - | - |
| 15°C | 0.79 | 0.09 | - | - | - | - | - | - | - |
| 15.55°C | 0.32 | - | - | - | - | - | - | - | - |
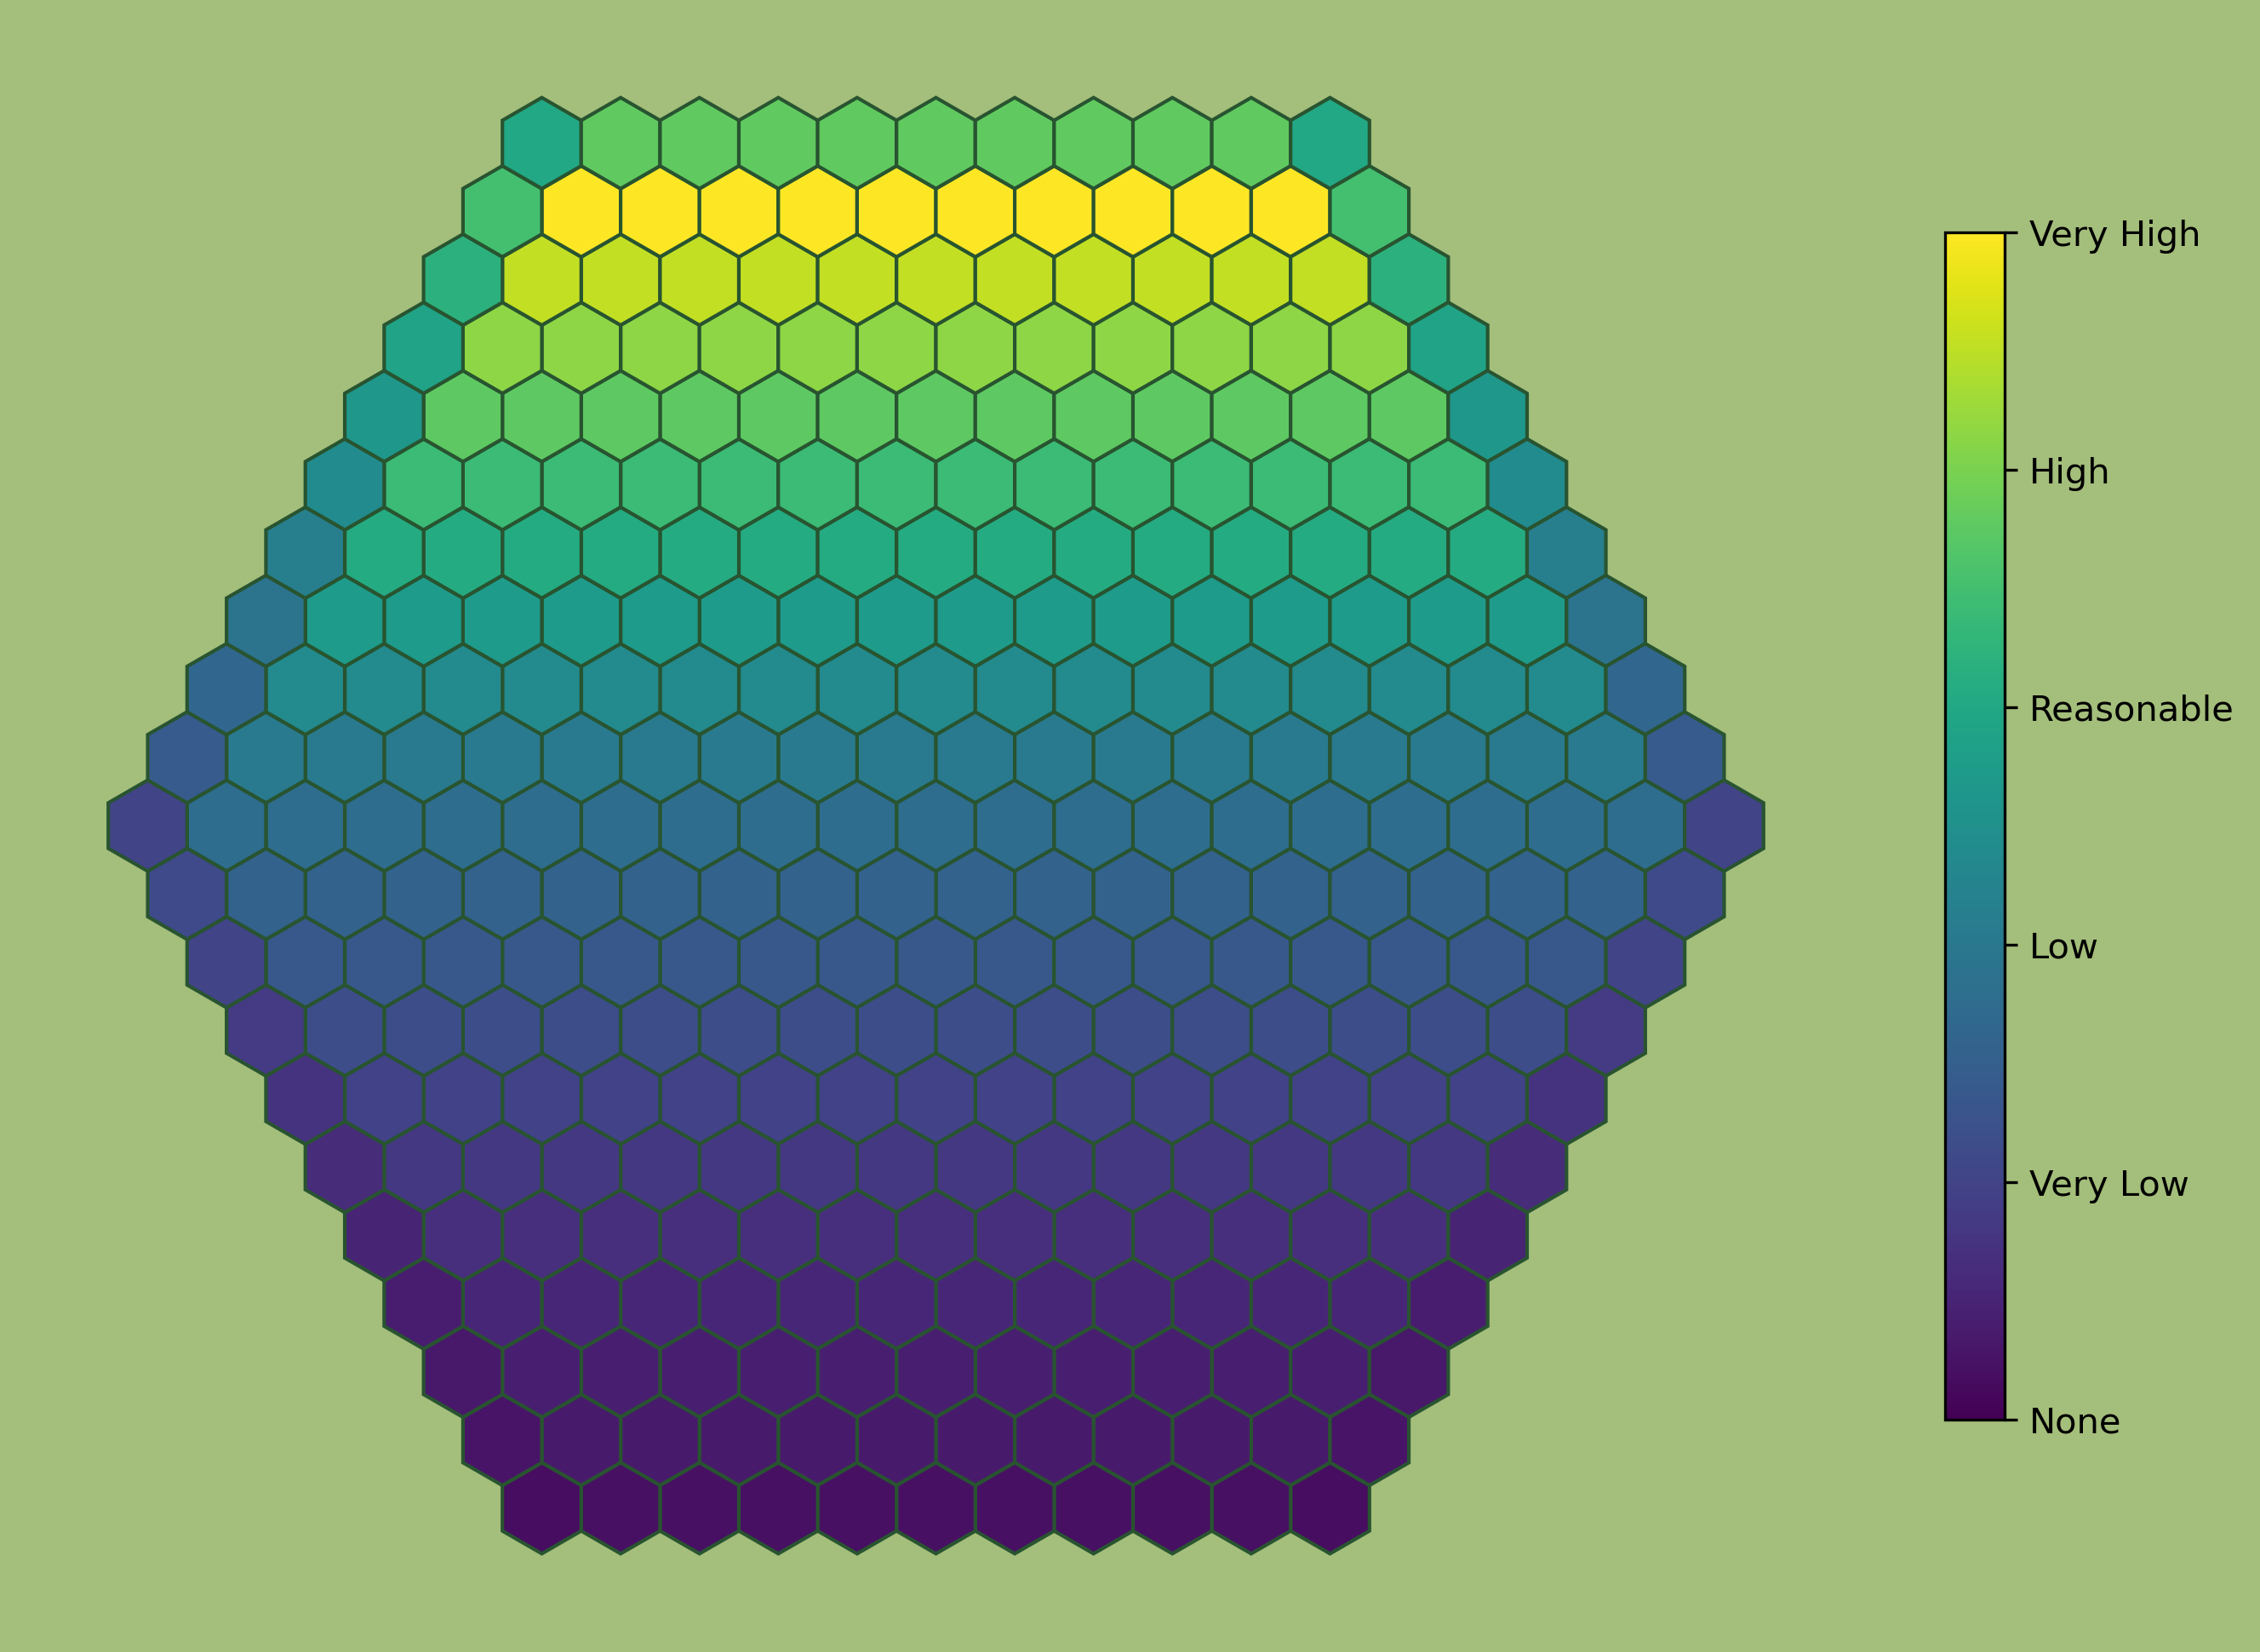
When a coldwave occurs, the tile it will affect (with it's neighbors) is chosen randomly following a normal distribution around the north pole. This means that the risk is higher in northern tiles and almost zero in southern tiles. Again the border tiles have lower risks due to their lower neighbor count. The following figure shows the probability distribution overlaid on the map.
Wildfire
Wildfires have a higher chance of occurring with higher global temperatures. They can damage facilities near forests and have a chance of cause an important reduction of the industries productivity. In addition to that, wildfires will release important amounts of CO2 in the atmosphere (10 kt).
| Recovery time | 2 days |
|---|---|
| Recovery cost | 60% of current industry revenues |
| Affected tiles | 7 (1 and its 6 neighbors) |
| Destruction chances |
Industry downgrade: 30% Steam Engine: 2% Watermill: 5% Windmill: 10% Onshore Wind Turbine: 5% Coal Burner: 2% Gas Burner: 2% Combined Cycle: 2% Concentrated Solar Power: 2% Photovoltaics: 5% |
The probability of the occurrence of a wildfire is affected by the servers current GAT, the higher the temperature the higher the risk. The following table shows the expected occurrence of wildfires per in-game day depending on the Reference GAT and the temperature anomaly.
| Temperature Anomaly | |||||||||
|---|---|---|---|---|---|---|---|---|---|
| -2°C | -1°C | 0°C | +1°C | +2°C | +3°C | +4°C | |||
| 11.75°C | - | - | - | - | - | 0.20 | 1.07 | ||
| 12°C | - | - | - | - | - | 0.35 | 1.40 | ||
| 12.5°C | - | - | - | - | 0.09 | 0.79 | 2.19 | ||
| 13°C | - | - | - | - | 0.35 | 1.40 | 3.15 | ||
| 13.5°C | - | - | - | 0.09 | 0.79 | 2.19 | 4.29 | ||
| 14°C | - | - | - | 0.35 | 1.40 | 3.15 | 5.60 | ||
| 14.5°C | - | - | 0.09 | 0.79 | 2.19 | 4.29 | 7.09 | ||
| 15°C | - | - | 0.35 | 1.40 | 3.15 | 5.60 | 8.75 | ||
| 15.55°C | - | 0.11 | 0.84 | 2.28 | 4.41 | 7.25 | 10.78 | ||
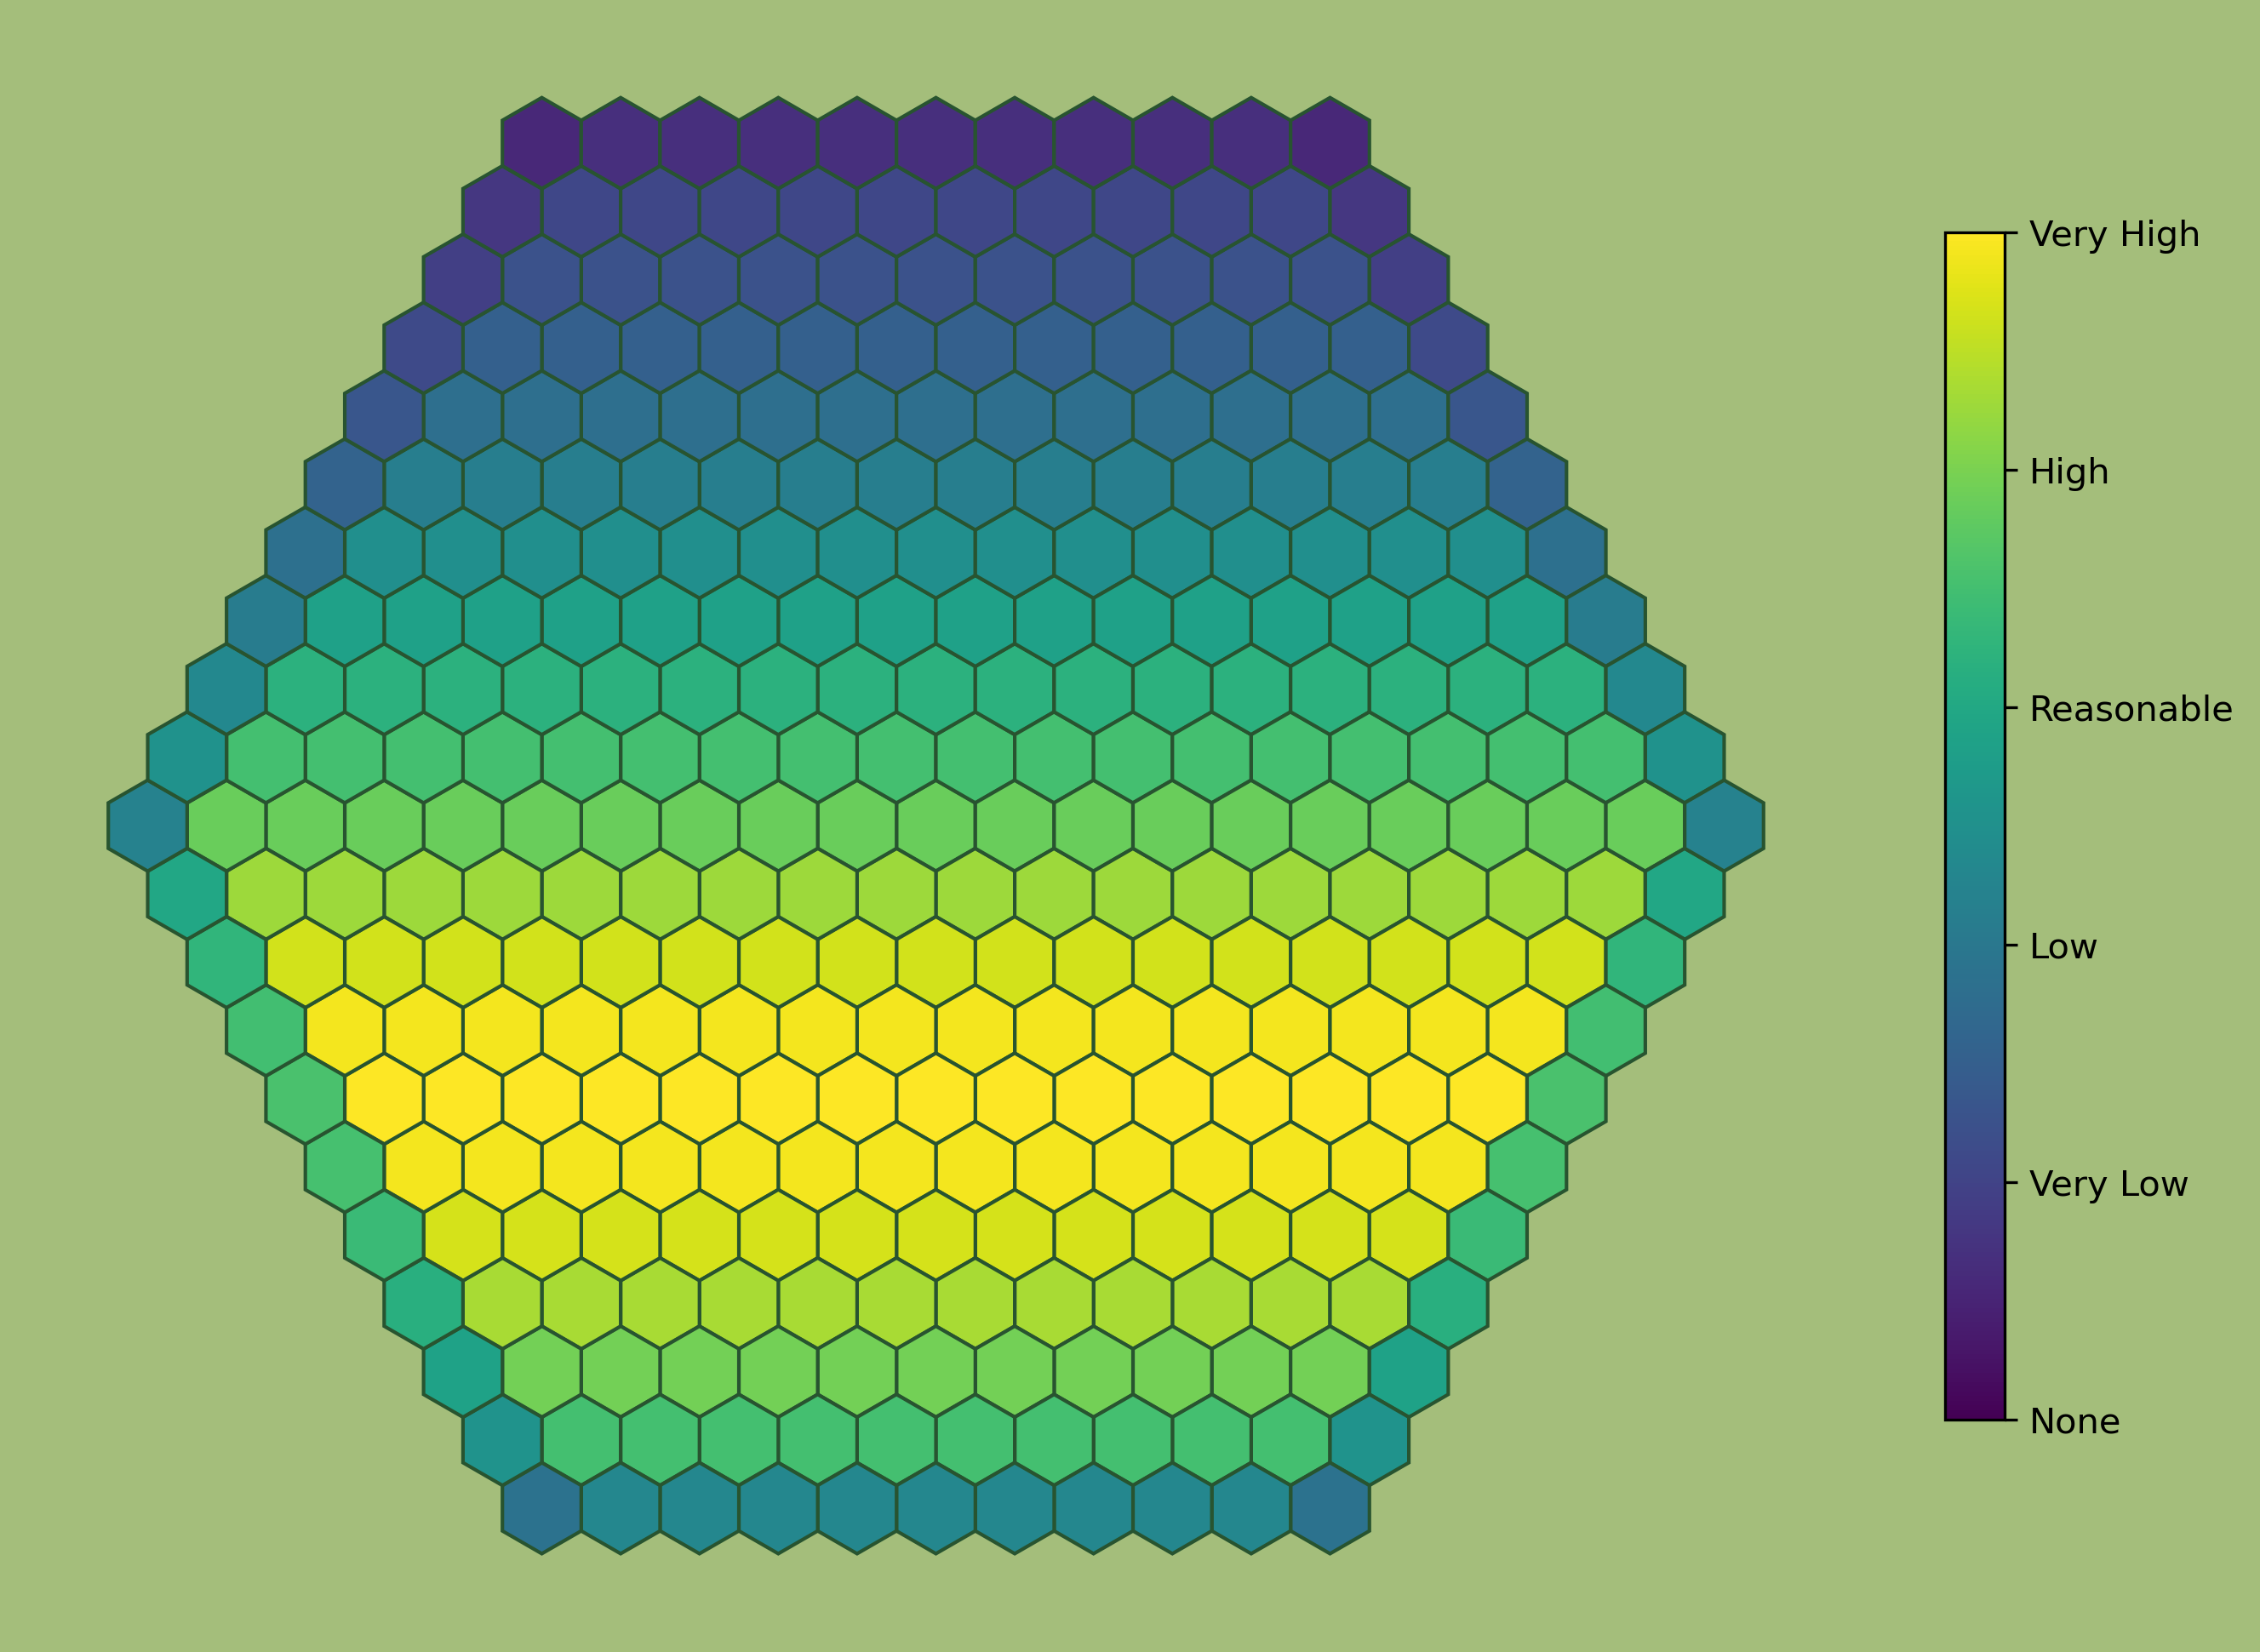
When a wildfire occurs, the tile it will affect (with it's neighbors) is chosen randomly following a normal distribution around the 30° latitude line. This means that the risk is higher in tiles in the south but in the far south we consider less vegetation and therefore less wildfire risks. Again the border tiles have lower risks due to their lower neighbor count. The following figure shows the probability distribution overlaid on the map.
Flood
Floods can only occur in tiles with a hydro potential higher than 20% and have a higher chance of occurring with higher global temperatures anomaly. They can damage facilities near rivers and have a chance of cause an important reduction of the industries productivity. Floods might destroy water dams and if this happens, the flood will be propagated to the downstream tiles.
| Recovery time | 6 days |
|---|---|
| Recovery cost | 50% of current industry revenues |
| Affected tiles | 1 |
| Destruction chances |
Industry downgrade: 50% Watermill: 60% Small Water Dam: 5% Large Water Dam: 2% Steam Engine: 5% Coal Burner: 3% Gas Burner: 3% Combined Cycle: 2% Nuclear Reactor: 1% 4th Generation Nuclear: 0.5% |
The probability of the occurrence of a flood is affected by the servers current temperature anomaly, the higher the deviation the higher the risk. The following graph shows the expected occurrence of floods per in-game day depending on the temperature anomaly.
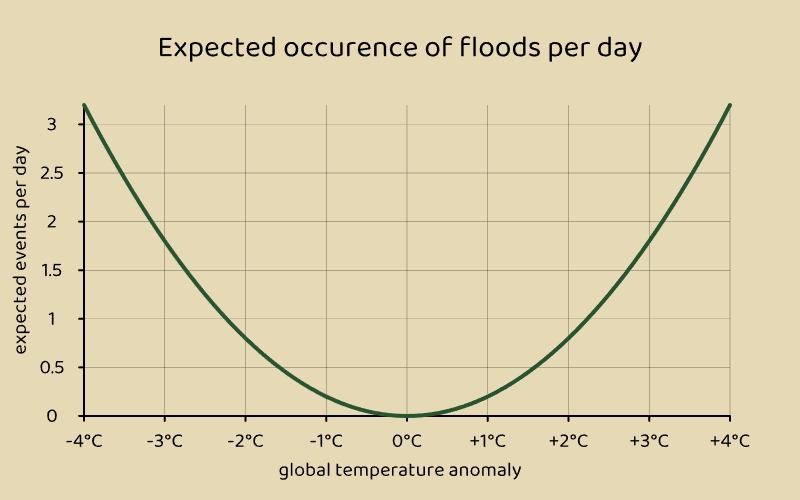
When a flood occurs, the tile it will affect is chosen randomly among the tiles with a hydro potential higher than 20%.
hurricane
The hurricane is the most destructive climate event. It can occur anywhere on the map and will affect a large area. hurricanes can destroy facilities and have a high chance of cause an important reduction of the industries productivity.
| Recovery time | 7 days |
|---|---|
| Recovery cost | 80% of current industry revenues |
| Affected tiles | 19 (a radius of 3 tiles) |
| Destruction chances |
Industry downgrade: 90% windmill: 50% Onshore Wind Turbine: 30% Offshore Wind Turbine: 20% Photovoltaics: 10% Concentrated Solar Power: 15% |
The probability of the occurrence of a hurricane is affected by the servers current temperature anomaly, the higher the deviation the higher the risk. The following graph shows the expected occurrence of hurricanes per in-game day depending on the temperature anomaly.
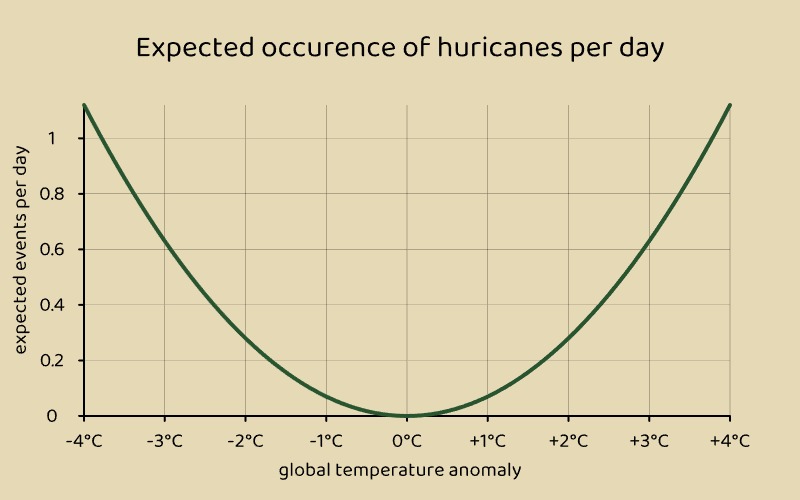
When a hurricane occurs, the tile it will affect is chosen randomly among all tiles.